Visualization of large-scale fluid dynamics
In turbulent flows it is very important to research how certain characteristic parameters are influenced by the flow. In thermal convection, the heat transfer is a good indicator if changing flow structures have a supporting effect or may disrupt a previously transport-favorable flow situation.
While two-dimensional visualizations are very helpful in understanding the behavior of the large-scale structures, they don’t show the complete scientific picture. They give a good indication of the flow behavior, but to understand thermal turbulence, it is vital to see the whole flow field and the dynamic interaction of turbulent structures with each other. The opportunity to observe the flow evolving and transitioning through different regimes is a great chance to not only statically observe different flow states at fixed locations in space, but to also actually follow the flow on its path to develop thermal plumes, streaks and meandering structures.
To support very large scale numerical simulations and enable the scientists to interpret their output, we deploy an interactive visualization framework to study sheared thermal convection. The visualizations are based on volume rendering of the temperature field. To address the needs of supercomputer users with different hardware and software resources, we evaluate different volume rendering implementations supported in the ParaView environment: two GPU-based solutions with Kitware’s native volume mapper or NVIDIA’s IndeX library, and a CPU-only Intel OSPRay-based implementation.
When presented with multiple visualizations including different illumination and shading, we preferred the renderings which emphasize the amorphous nature of the field data. As can be seen in figure 1, shading based on gradient estimation offers little improvement because our data does not have strong gradients, and the use of shadows which at first might seem more appealing, produces images with a strong surface-like look, which we discarded upon further analysis.
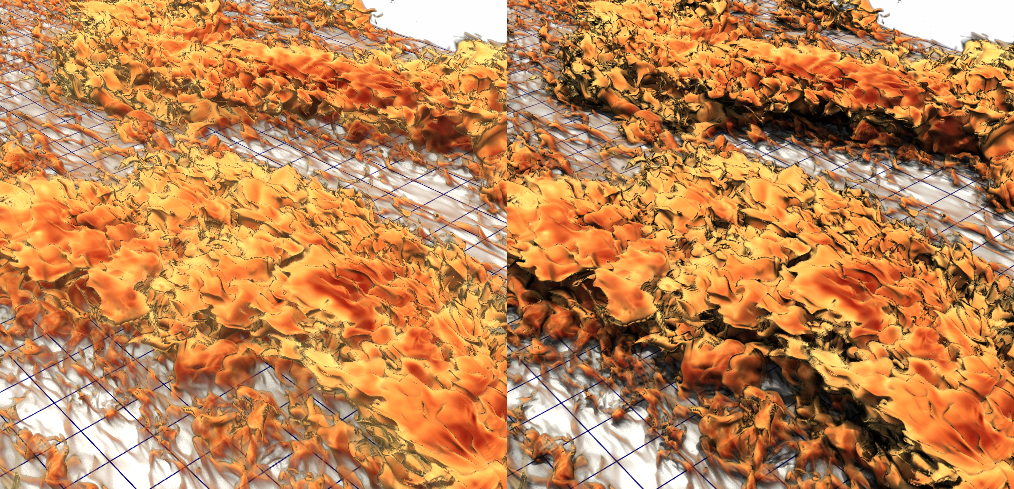
Figure 1: Volume rendering with shading based on gradient estimation (left), and with OSPRay-enabled shadows (right).
References
J. Favre, A. Blass
A comparative evaluation of three volume rendering libraries for the visualization of sheared thermal convection,
Parallel Computing 88, 102543 (2019)